Summary:
Monitor APC ups devices with the apcupsd linux service and output the results to prometheus and grafana for graphing and alerting. This guide is specifically for usb connected apc devices but in theory other devices would work fine too.
Step 1: Install apcupsd
Connect your apc ups to any ubuntu/debian server with a usb port. Then once installed run the following to get the monitoring service online:
sudo apt update && sudo apt install -y apcupsd && sudo systemctl enable apcupsd
Next, we need to set the service to auto-detect the desired usb port by editing /etc/apcupsd/apcupsd.conf, commenting out the DEVICE line:
apcupsd.conf
#DEVICE /dev/ttyS0
Lets restart the service and then make sure its working properly:
sudo systemctl restart apcupsd
apcaccess
You should see the STATUS output of ‘ONLINE’ when running the apcaccess command
Step 2: Install apcupsd_exporter:
First lets get some prereq packages:
sudo apt-get install golang git
Next, clone the git repo for apcupsd_exporter on the server and build the package:
git clone https://github.com/mdlayher/apcupsd_exporter.git
cd apcupsd_exporter/cmd/apcupsd_exportergo buildsudo cp apcupsd_exporter /usr/local/bin/apcupsd_exporter
You can verify the exporter is working properly by running the binary and seeing if the metrics are showing:
./apcupsd_exporter
curl https://localhost:9162/metrics
Once its verified working, lets make it a service so that it continues to run on reboot:
nano /etc/systemd/system/apcupsd_exporter.service
[Unit]
Description=apcupsd_exporter

[Service]
TimeoutStartSec=0
ExecStart=/usr/local/bin/apcupsd_exporter

[Install]
WantedBy=multi-user.target
Then enable and start the service:
sudo systemctl daemon-reload
sudo systemctl enable apcupsd_exporter
sudo systemctl start apcupsd_exporter
Step 3: Configure the prom-operator to monitor the service
Create a new kubectl yaml file that creates the servicemonitor for prometheus:
apc-monitor.yamlapiVersion: monitoring.coreos.com/v1
kind: ServiceMonitor
metadata:
name: apcups-exporter
namespace: default
spec:
endpoints:
- interval: 10s
port: metrics
namespaceSelector:
matchNames:
- default
selector:
matchLabels:
k8s-app: apcups-exporter
Now lets apply that newly created yaml file into our kubernetes cluster:
kubectl apply -f apc-monitor.yaml
With the monitor service online, we then have to give it somewhere to link to, lets create another file for the service, the external name should be the dns name of the server we installed the apcupsd_exporter on earlier:
apc-service.yaml
apiVersion: v1
kind: Service
metadata:
  labels:
    k8s-app: apcups-exporter
    name: apcups-exporter
    namespace: default
spec:
  externalName: server01.k3s.live
  ports:
    - name: metrics
    port: 9162
    protocol: TCP
    targetPort: 9162
  sessionAffinity: None
  type: ExternalName
And apply the service:
kubectl apply -f apc-service.yaml
Lastly, lets create an endpoint that links the service to the external server, be sure to replace <ip> with the ip address of your apcupsd server:
apc-endpoint.yaml:
apiVersion: v1
kind: Endpoints
metadata:
  labels:
    k8s-app: apcups-exporter
  name: apcups-exporter
  namespace: default
subsets:
  - addresses:
      - ip: <ip>
    ports:
      - name: metrics
        port: 9162
        protocol: TCP
kubectl apply -f apc-endpoint.yaml
Step 4: The grafana dashboard
This is where all the effort pays off. Log into your Grafana dashboard/server/service and import the following dashboard:
https://grafana.com/grafana/dashboards/21119-apc-ups-dashboard
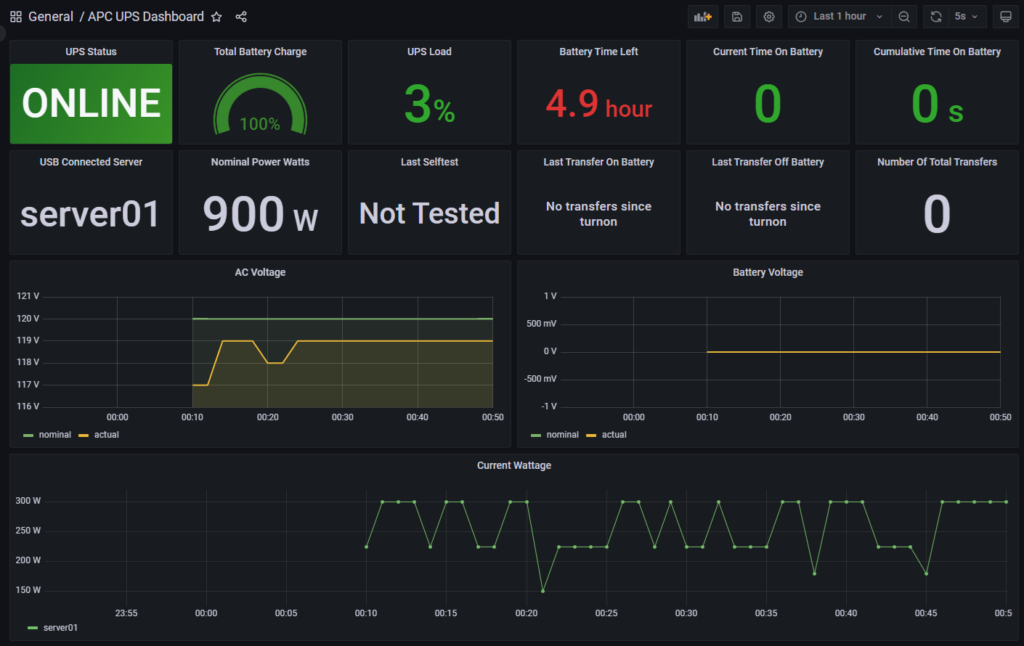
And that’s it, you now have a beautiful Grafana dashboard tracking all of your ups stats, you can even take this one step further by creating alerts based on the graph panels if you so choose.